Output Files
Output files from the PrM DAQ are saved in the data_files_path directory specified in the
settings.yaml configuration file. The files are in npz and/or text format
(configurable in settings.yaml). They contain the following information:
ch_A: numpy array containg waveform from channel Ach_B: numpy array containg waveform from channel Bch_time: time data was taken in Y-m-d H:M:S.frun: run numberdate: date data was taken in Ymd-HMS formathv: ‘on’ or ‘off’comment: the comment if anyhv_anode: value of anode HV [V]hv_anodegrid: value of anode grid HV [V]hv_cathode: value of cathode HV [V]samples_per_sec: number of acquired samples per secondpre_trigger_samples: number of pretrigger samplespost_trigger_samples: number of posttrigger samplesinput_range_volts: input range in Volts
Opening an Output file
The npz outputs can be opened like:
import numpy as np
container = np.load('file_name.npz')
cathode_wvf = container['ch_A']
anode_wvf = container['ch_B']
samples_per_sec = container['samples_per_sec']
x = np.arange(len(cathode_wvf)) / samples_per_sec * 1e3 # ms
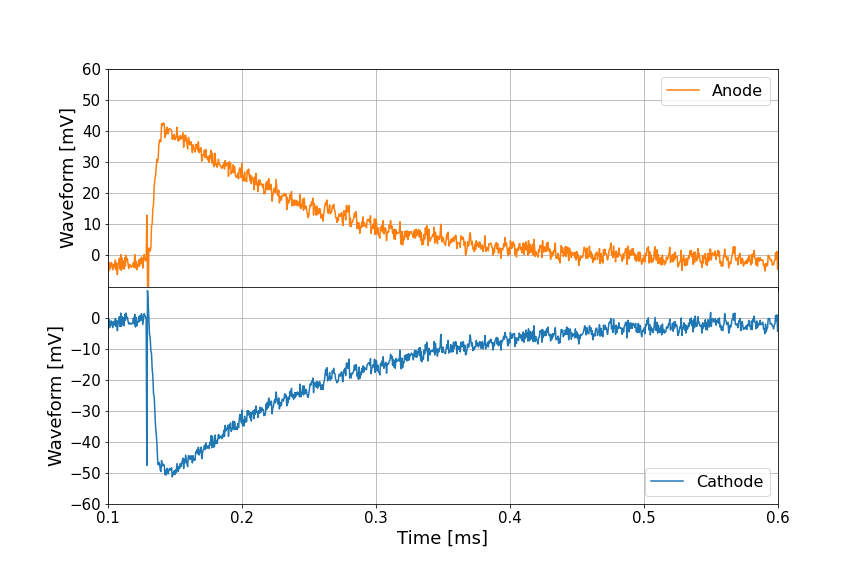
fig, ax = plt.subplots(ncols=1, nrows=2, figsize=(12, 8), sharex=True)
fig.subplots_adjust(hspace=0)
x_scale = 1
y_scale = 1e3
ax[1].plot(x * x_scale, anode_on * y_scale, label='Cathode')
ax[0].plot(x * x_scale, cathode_on * y_scale, label='Anode')
The text outputs are of the form:
ch_A=[[0.11534820667744995,-1.0751930546414368,...]]
ch_B=[[-1.2907774641861673,0.19290700054296683,...]]
ch_time=2024-01-26 19:41:36.658627
run=301
date=20240126-194136
hv=off
...
If reading these with python the method literal_eval() of the built-in ast library is
useful for converting the list strings to python lists